Revizto continues to improve its very powerful web Dashboard features. The web Dashboard gives a live view of issues for your team, and can be completely customised to give the most focused overview of your current project Status.
To create a web Dashboard and Group by Tag, just follow these easy steps:
-
-
- Open https://ws.revizto.com and access the Project you want to work on
- Click on Dashboard
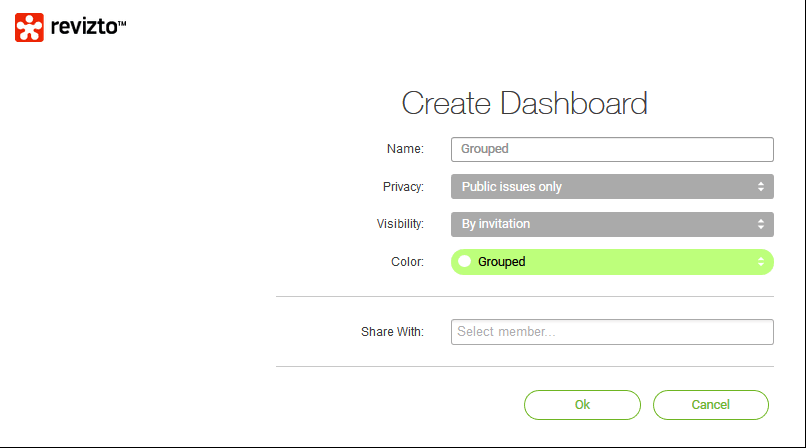
- Click “Add New Dashboard”

- In the Dashboard view, click “Add New Chart”
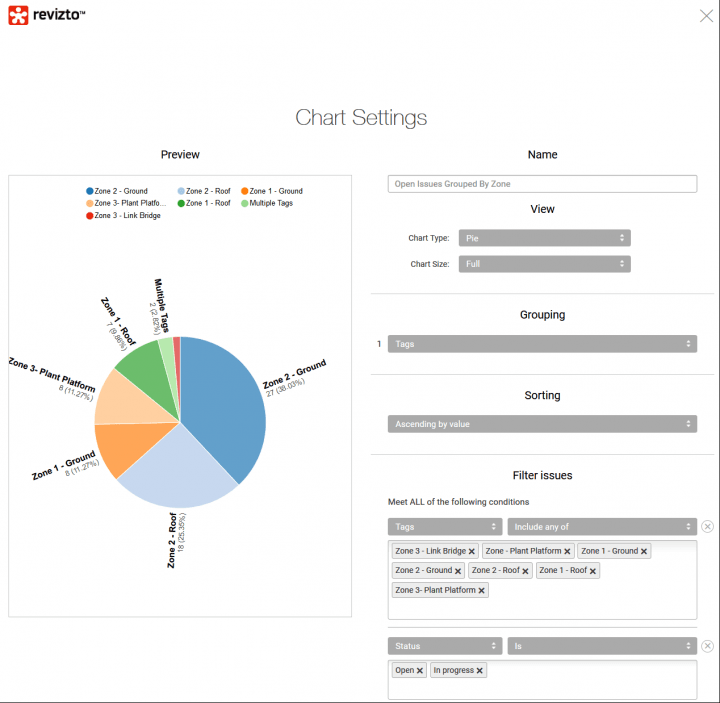
- Customise the chart to include only certain tags, and enable the Grouping by Tags function. Below is an example:

-

In the above example, you can see how I included only the high level tags that are used (on this project) to keep track of the construction zone of specific issues. Then, the Grouping function slices those issues and gives us quick insight into the Zones requiring immediate action by the project management team.
I’m sure you can see how easy it is to setup powerful and focused dashboards to successfully manage your BIM and Construction team with these new web features in Revizto.
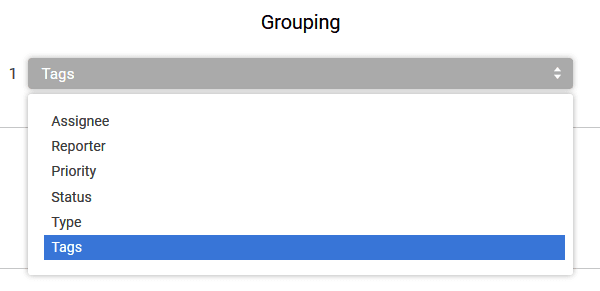
Here are the other currently supported Grouping categories in Revizto: